Synametrics Technologies
Revolving around the core of technology
Backup Reports Explained
Users can optionally configure Syncrify to generate a report via email at the end of every synchronization job. These reports are available in two formats:
- HTML - with graphs
- Plain Text
This page explains the information presented in the HTML report.
This report is divided into multiple sections, which are described below.
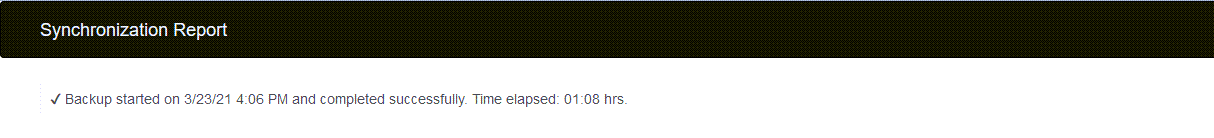
Section 1 - Header
A header is displayed towards the top containing a summary of when the job started, how long it took and if it ran into any errors. The following image display this header section.
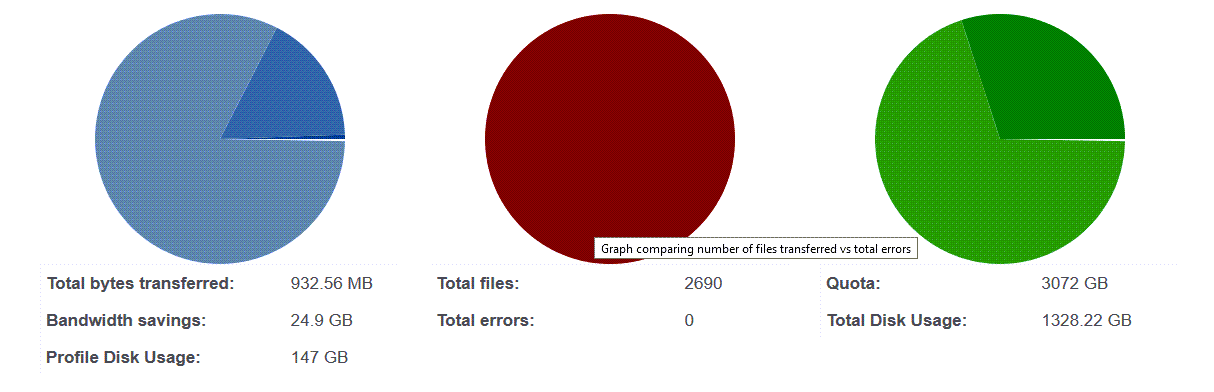
Section 2 - Graphs
This section contains either two or three graphs. The first graph highlights the benefits of using Delta Backup. In the example below, you see the entire dataset is around 147 GB. Files adding up to 25.8 GB were modified. However, the actual data transferred over the network was 932 MB, which is less than 1% of the entire dataset. Essentially, you saved 24.9 GB by using the Delta Backup in Syncrify.
The second graph display total files transferred compared to total errors. No errors are displayed in this example, and therefore, the graph is just one color.
The third graph is only displayed if user quotas are enforced and show the amount of data already used by the user.
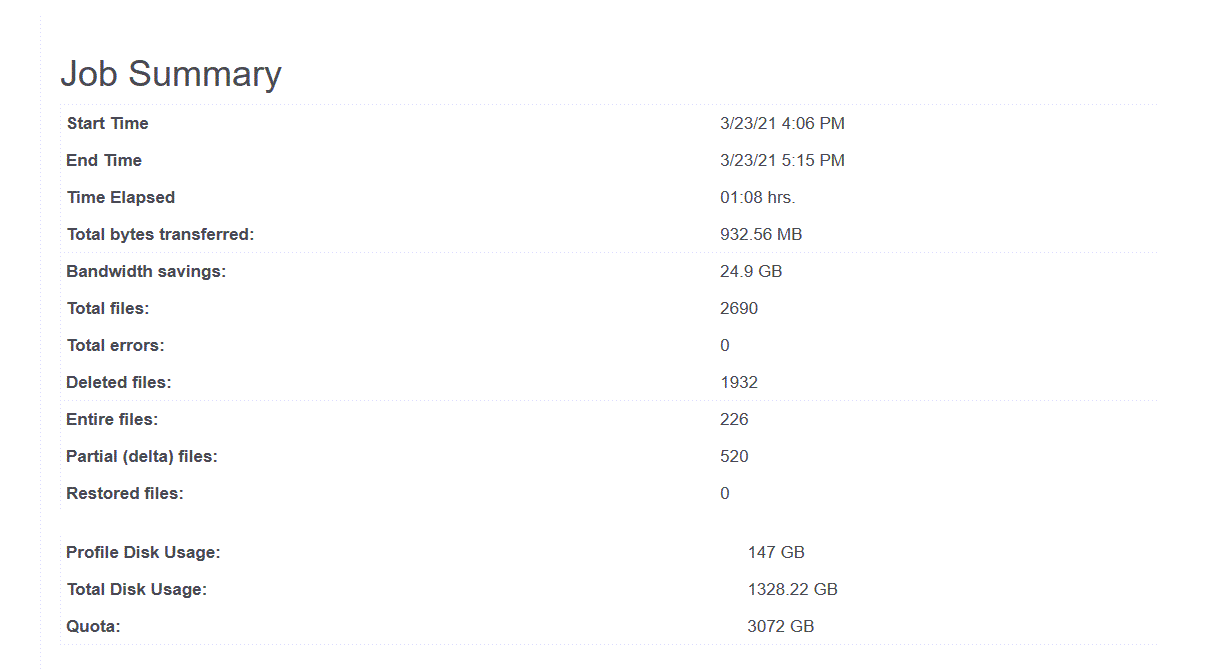
Section 3 - Job Summary
Several parameters are displayed related to the job in a summarized table. These parameters are explained in detail on this page.