The Query Workspace
The query workspace is where developers work with databases: browsing objects, writing and running SQL, and viewing results.
Opening the workspace
Users who have only the Developer role see the workspace as soon as they sign in. Users who also have the Administrator or DB Manager role start on the Dashboard; they open the workspace by clicking Query Window in the side menu, and return with Administration in the user menu.
The first time you open the workspace, you're not connected to a database yet. See Connecting to a Database.
A tour of the workspace
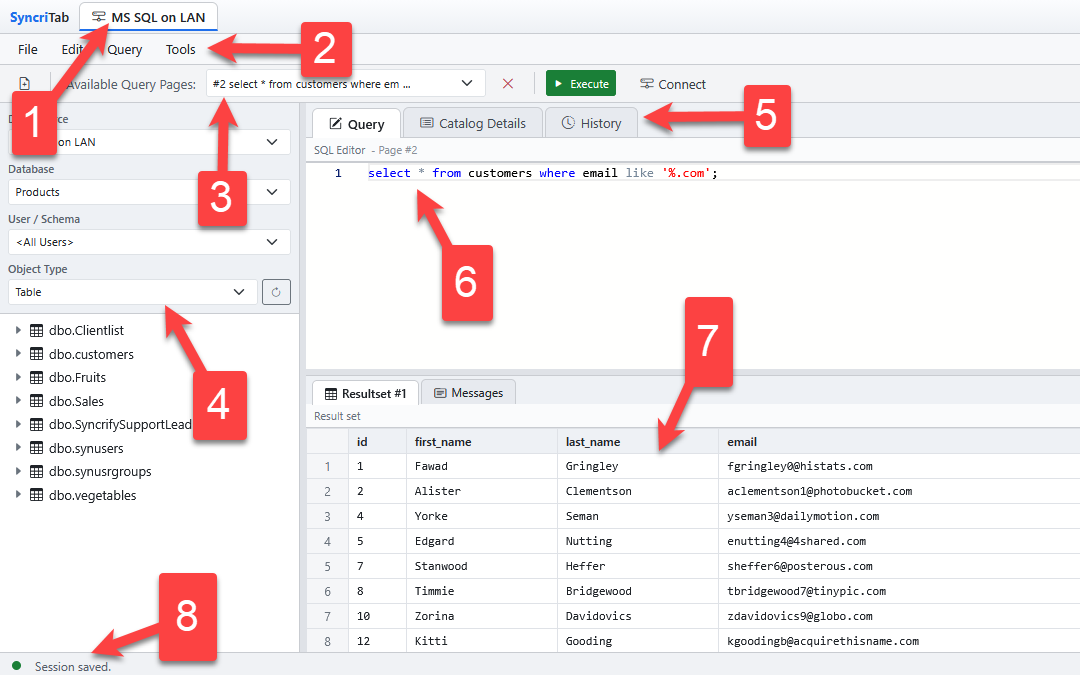
1. App bar
- Connection name: the data source you're connected to, or Not connected.
- File name: the saved script or workbook open on the current query page, if any.
- Theme button: switches between the light and dark theme. Your choice is remembered in this browser.
- User menu: click your name to set up Two-Factor Authentication, Change Password, Contact Support, or Sign Out. Users who also have the Administrator or DB Manager role also see Administration here. See Your Account.
2. Menu bar
| Menu | Commands |
|---|---|
| File | New Connection, New Query Page, Open File, Open Workbook, Save, Save As, Save Workbook, Close Connection, and Logout. See Connecting to a Database and Query Pages, Scripts & Workbooks. |
| Edit | Comment Block, Uncomment Block, Find, Replace, and Options. See Writing SQL and Options & Preferences. |
| Query | Execute and Export. See Running Queries & Results and Exporting & Importing Data. |
| Tools | Schema Diff, Database Search, Reverse Engineering, Scheduler, and Customize Shortcuts. See Schema Diff, Database Search, Reverse Engineering, Task Scheduler, and Keyboard Shortcuts. |
Menu commands that have a keyboard shortcut show it next to their name.
3. Toolbar
- New query page button: adds a query page.
- Available Query Pages: switches between your query pages. Each page has its own SQL and results. The red × closes the current page. See Query Pages, Scripts & Workbooks.
- Execute (F5): runs the SQL in the editor, or just the selected part. See Running Queries & Results.
- Connect: opens a connection to a data source.
4. Catalog pane
The left side shows what's in the database. Four lists narrow it down, from top to bottom: Data Source, Database, User / Schema, and Object Type, such as tables or views. The tree below lists the matching objects; expand an object to see its columns and other details. Some databases don't use databases or schemas, and those lists are then unavailable. See Browsing the Catalog.
5. Tabs
| Tab | Use it to |
|---|---|
| Query | Write and run SQL and view the results. This is where you'll spend most of your time. |
| Catalog Details | See the details of the object selected in the catalog tree, such as a table's data or a procedure's source code. See Browsing the Catalog. |
| History | Find and re-run queries you ran earlier. See Query History. |
6. SQL editor
The top of the Query tab is the SQL editor, with syntax highlighting and suggestions as you type. The label above it shows which query page you're on. See Writing SQL.
7. Results pane
The bottom of the Query tab shows what your SQL returned. Each result set gets its own tab, such as Resultset #1 and Resultset #2, and the Messages tab lists messages from the database, such as how many rows were changed. See Running Queries & Results.
8. Status bar
The bar at the bottom shows whether you're connected, with a colored dot, and messages such as Session saved. On the right, it shows how long the last query took.
Resizing the panes
Drag the divider between the catalog pane and the tabs to give either more room. On the Query tab, drag the divider between the SQL editor and the results to change their heights.
One connection at a time
The workspace is connected to one data source at a time. Choosing New Connection replaces the current connection, and Close Connection disconnects. If auto-save is on, your query pages and results are restored when you connect to the same data source again. See Saved Sessions.