Dashboard
The Dashboard gives administrators and DB Managers a quick view of the SyncriTab server: how many people and databases it serves, who is connected right now, and how much memory and disk space it uses.
Opening the Dashboard
Administrators and DB Managers see the Dashboard as soon as they sign in. To return to it from another page, click Dashboard in the side menu. Users who have only the Developer role don't have a Dashboard.
The line under the heading shows your roles, for example Overview of your SyncriTab server, Administrator & DB Manager.
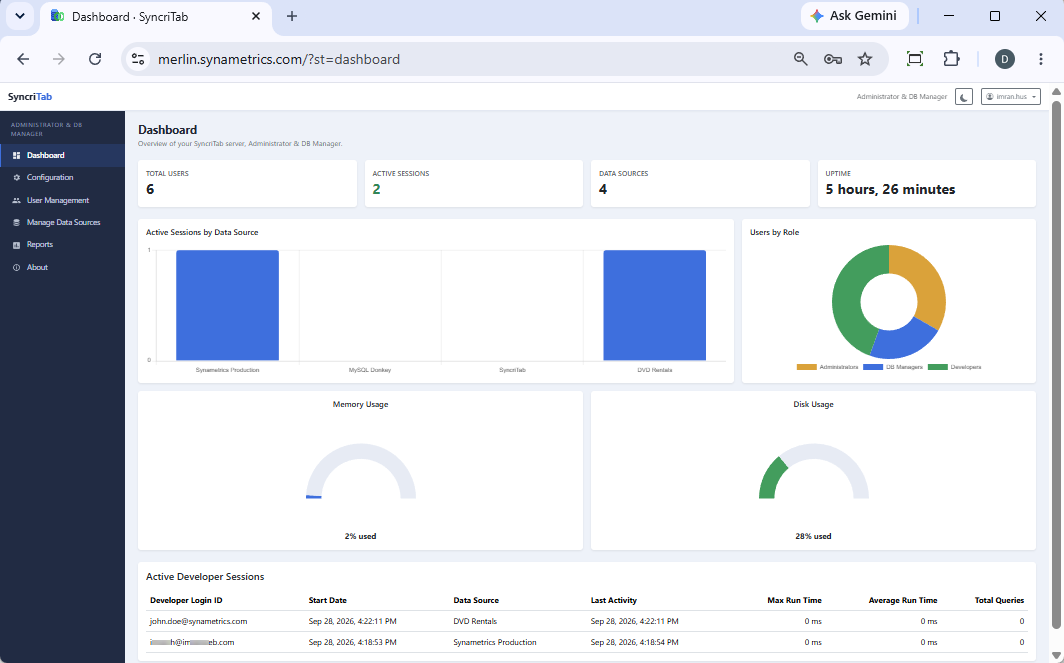
The Dashboard shows the figures from the moment the page opened. It doesn't update by itself. To see current figures, reload the page.
Summary cards
Five cards across the top give the headline figures:
| Card | What it shows |
|---|---|
| Total Users | The number of user accounts, whatever their roles. An account with several roles is counted once. |
| Active Users | The number of developers connected to at least one data source right now. A developer with several open connections is counted once. |
| Active Sessions | The number of database connections open right now. Each connection a developer opens to a data source is one session, so a developer connected to two data sources has two sessions. |
| Data Sources | The number of data sources that have been set up. See Data Sources & Permissions. |
| Uptime | How long SyncriTab has been running since it last started, for example 3 days, 4 hours, 12 minutes. |
Charts
Active Sessions by Data Source
A bar for each data source shows how many sessions are open to it right now. Data sources with no open sessions appear with an empty bar. Use it to see which databases are busiest.
Users by Role
How many accounts have each role: Administrators, DB Managers, and Developers. An account with more than one role is counted under each of its roles, so these numbers can add up to more than Total Users.
The Developers count is the number your license is based on. See Roles and licensing.
Memory Usage
How much of the memory available to SyncriTab is in use, as a percentage. This is the memory SyncriTab's Java process is allowed to use, not the server's total memory.
The figure normally rises and falls as people work. If it stays close to 100% even when few people are connected, or users report that SyncriTab is slow, the server may need more memory. See Memory in the System Requirements.
Disk Usage
How full the disk that holds SyncriTab's data is, as a percentage. This is the whole disk, so other programs' files count too.
Saved sessions, exported files, query history, and log files grow over time. If the figure keeps rising, free up space or move SyncriTab to a larger disk before it fills up. See Disk space in the System Requirements.
Active Developer Sessions
DB Managers also see a table of every open session, sorted by data source and then by developer. Administrators who aren't DB Managers don't see this table.
| Column | What it shows |
|---|---|
| Developer Login ID | The developer who opened the connection. |
| Start Date | When the connection was opened. |
| Data Source | The data source the developer is connected to. |
| Last Activity | When the developer last used the connection. |
| Max Run Time | The longest time any query on this connection has taken. |
| Average Run Time | The average time the queries on this connection have taken. |
| Total Queries | How many queries the developer has run on this connection. |
If nobody is connected, the table shows No active developer sessions.
Sessions that have been idle for longer than the Session Time setting (30 minutes by default) close automatically, along with their database connections. See Security & Encryption.
Using the Dashboard
- Before a restart or update, check Active Sessions. Restarting SyncriTab closes every open connection, so pick a time when few people are connected. See Updating & Restarting.
- To find slow queries, look for high Max Run Time values in the Active Developer Sessions table. For more detail, see the Query Activity report under Reports.
- When planning your license, compare the Developers count in Users by Role with the number of users your license covers. See Licensing & Purchasing.
- To keep the server healthy, check Memory Usage and Disk Usage from time to time.