ER Diagrams
An entity-relationship (ER) diagram shows a table together with the tables it's linked to by foreign keys, so you can see at a glance how your data fits together before you write a join.
Opening a diagram
- In the catalog pane, choose Table in the Object Type list. See Browsing the Catalog.
- Expand the table you're interested in.
- Click Manage Relationships.
The diagram opens on the Catalog Details tab. Its title bar shows the table's name and how many relationships were found.
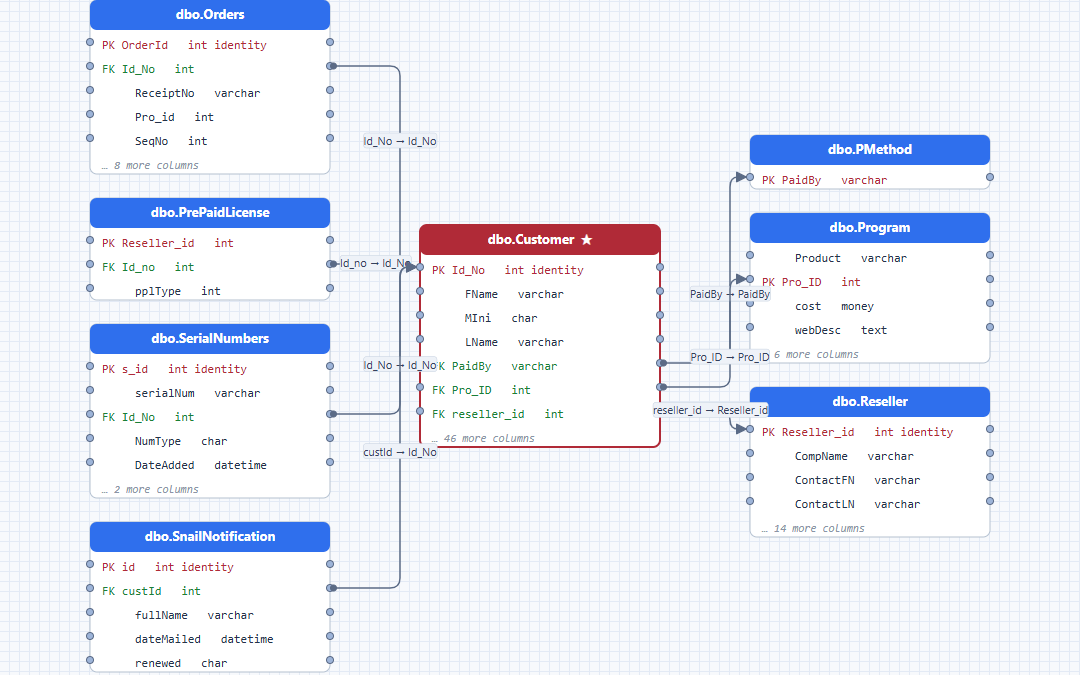
Reading the diagram
The diagram shows the table you opened and every table directly linked to it:
- The central table, the one you opened, is in the middle, with a red header.
- Tables it refers to through its own foreign keys, such as a
Customerstable for anOrderstable, are on the right. - Tables that refer to it, such as
OrderItemsforOrders, are on the left.
Related tables have a blue header. Each line connects a foreign key column to the column it refers to. The arrow points at the referenced table, and the label on the line names both columns, for example customer_id → id.
Inside each table, primary key columns are marked PK and foreign key columns FK, and each column shows its data type. A legend in the corner of the diagram explains the colors.
Which columns are shown
To keep the boxes small, each table shows:
- all of its primary key columns,
- all of its foreign key columns that appear on the diagram, and
- up to three other columns, in the order they're defined.
If a table has more columns, its last row says how many are hidden, for example … 12 more columns. To see every column, expand the table's Fields folder in the catalog pane.
Arranging the diagram
- Move a table: drag it. Its lines follow.
- Move around the diagram: drag an empty part of it. The pointer changes to a hand.
- Zoom: click Zoom in or Zoom out in the title bar.
- See everything: click Fit to size the diagram so every table is visible.
- Start over: click Reset layout to put every table back where it started.
Your arrangement isn't saved. Opening the diagram again, or opening another item in the catalog, starts from the original layout.
The diagram follows the workspace's light or dark theme.
What the diagram includes
- Only tables directly linked to the central table are shown. To follow the chain further, open Manage Relationships for one of the related tables.
- To keep the diagram readable, it shows at most 25 related tables: first the tables the central table refers to, then the tables that refer to it. If there are more, the title bar says how many aren't shown, for example 7 more related tables not shown. To see a table that was left out, open Manage Relationships for that table instead.
- Relationships come from the foreign keys defined in the database. If two tables are related only by convention, for example by matching column names without a foreign key, no line is drawn.
- A table that refers to itself, such as an
Employeestable with amanager_idcolumn, has a line that loops back to it. - Views and stored procedures don't have diagrams, because they don't have foreign keys.
If the title bar says no related tables, the table has no foreign keys and no other table refers to it, or your database driver doesn't report foreign keys.